Analyse your data
Compare each answer or data record. Count what the evidence supports and document how you calculated the result.
QUESTIONS
SUPPORT WITH EVIDENCE
JUSTIFY
I've collected the answers. What should I count?
- Set the rule first
- Count each answer that contains at least one unsupported claim once.
- Compare the results
- Apply the same scoring rule to both groups. Record how many answers each group contains.
Check a specific answer
- Check the claim
- The AI answer says 50 MB. The handbook sets a limit of 20 MB. Score this answer as 1.
- Check the reference
- The reference points to the right section, but the figure in the answer is still wrong.
- Complete the table
- Record the two checks separately so someone else can review your assessment.
Check your calculations
- Write down what counts
Set the rule before you start.
- Check the numbers
Recalculate one value and consult the original source for a case that stands out.
- Record the finding
Describe what you found and what the finding can support.
A prompt you can adapt
Here are my scoring rule and an example I can share [rule and example]. Point out two ways I might miscount. I will check the calculations myself.
Quick check Could someone reproduce my figure from the same answers?

Recount the results yourself
The case study question How many AI answers contain at least one unsupported claim? I compare answers to the same questions, first without and then with a request to cite the exact section of the IT service handbook.
Count the answers and compare the groups
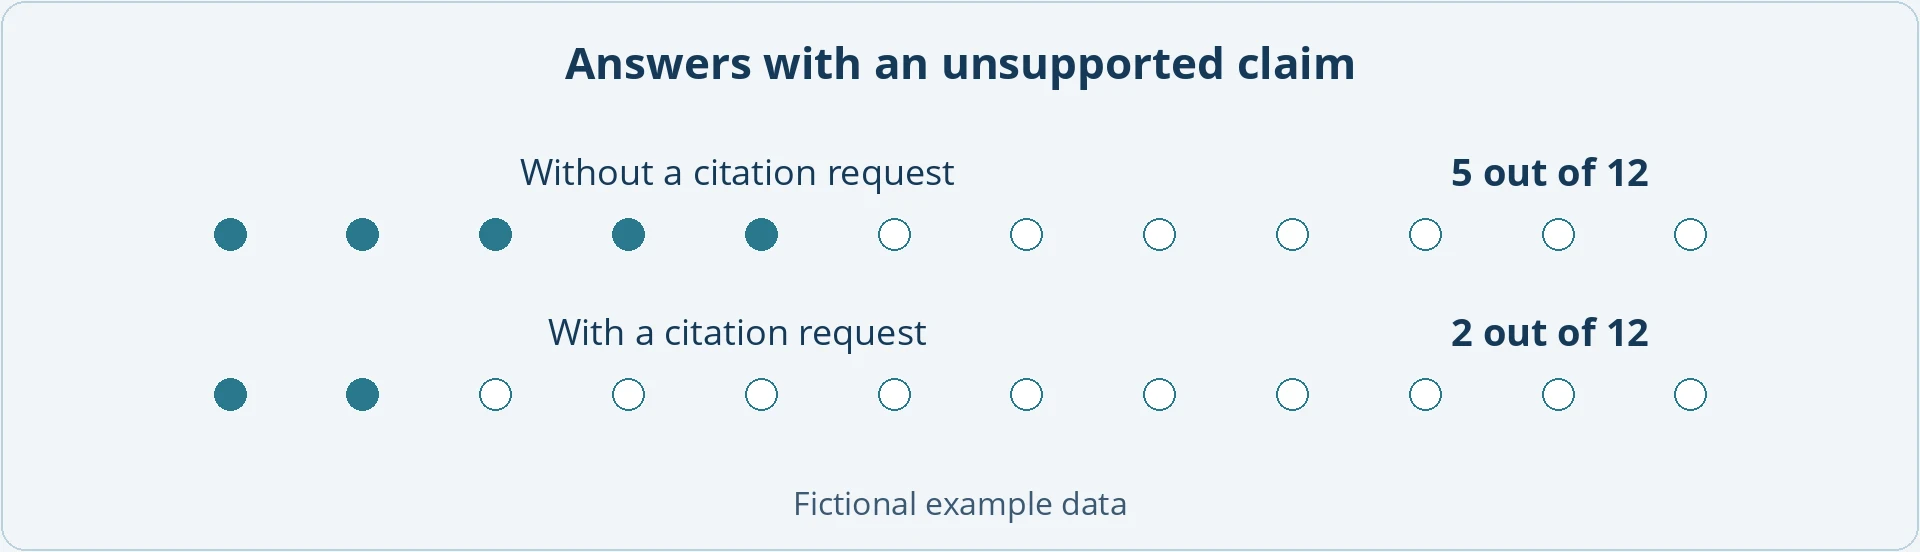
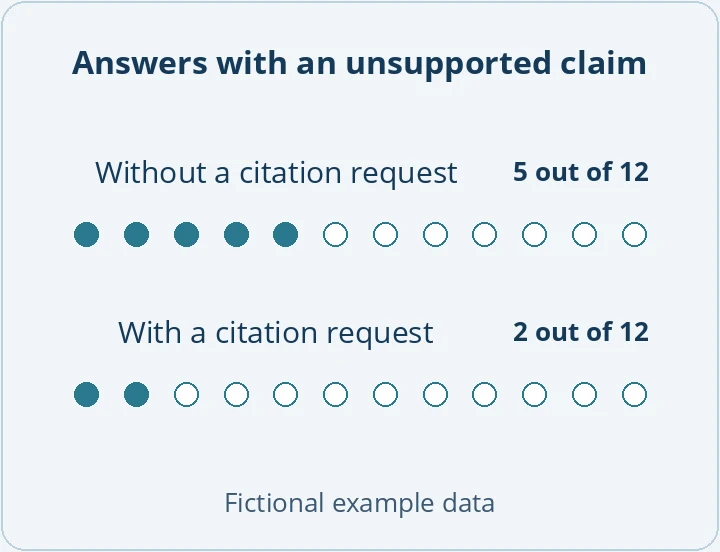
Match two answers to each question. In each group, count any answer containing a false or unsupported claim once. In the fictional data, 5 of 12 answers without a citation request contained at least one false claim or one the handbook could not support. With a citation request, the figure was 2 of 12. That is 41.7% without a citation request and 16.7% with one, a difference of 25 percentage points.
These figures are from the exercise. For your own study, use the answers you actually collected.
A fictional exchange to work through
My question for the AI
The answer says “Until 4 pm”. The citation points to “Enquiries”. How should I check it?- What the AI says
- The AI judges the whole answer unsupported because the reference is wrong.
- How I check it
- The “Service desk” section really does say 4 pm. I record that the time is right and the reference points to a different section.
- What I record
- I keep both references and my reasoning.
Which questions show a change?
Place the two answers to each question side by side. In the sample data, the unsupported claim disappears for three questions: the loan period, device repair and the late fee. Two errors remain: the file size for campus printing and whether USB-C adapters are available.
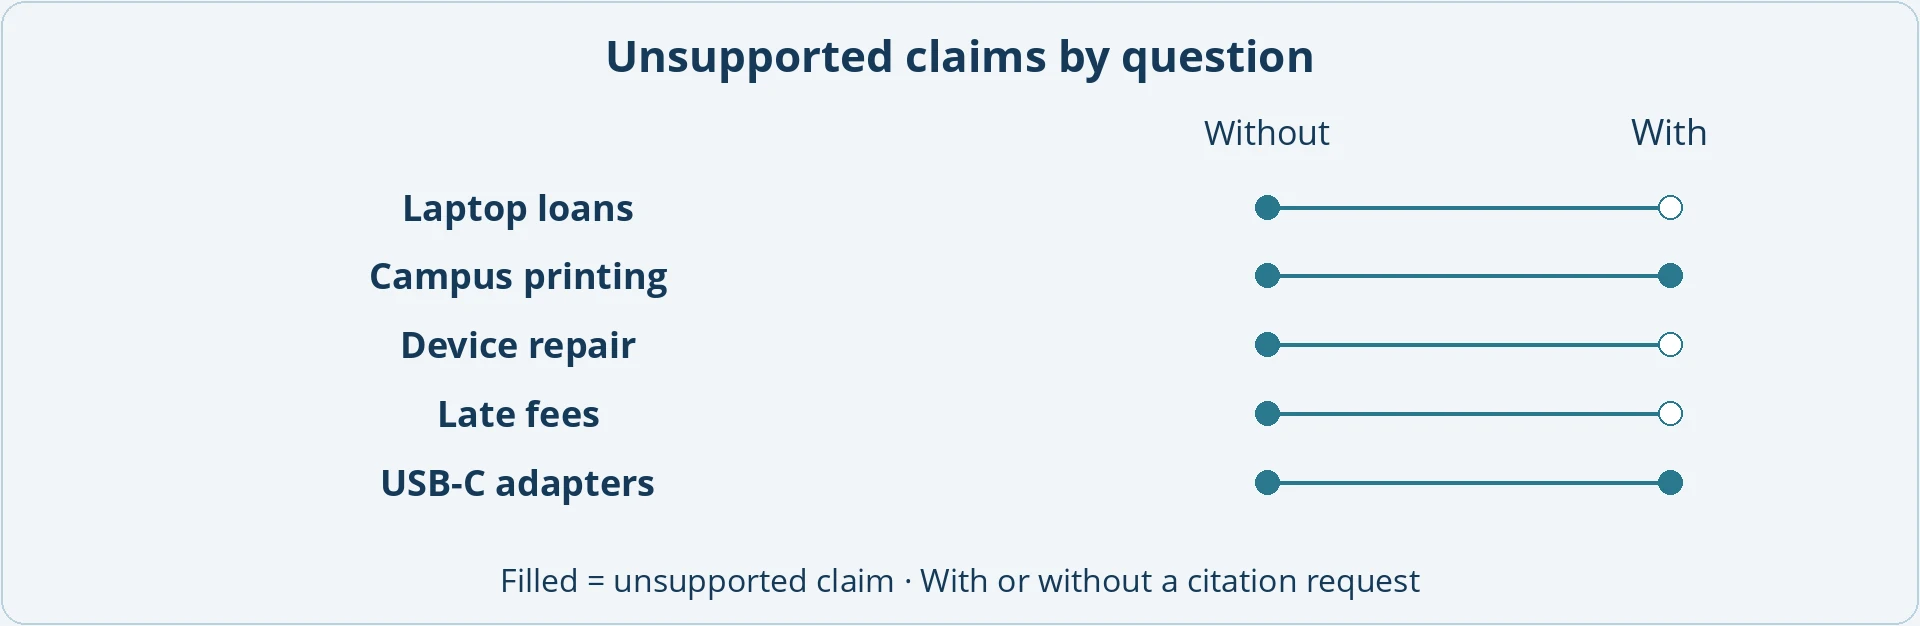
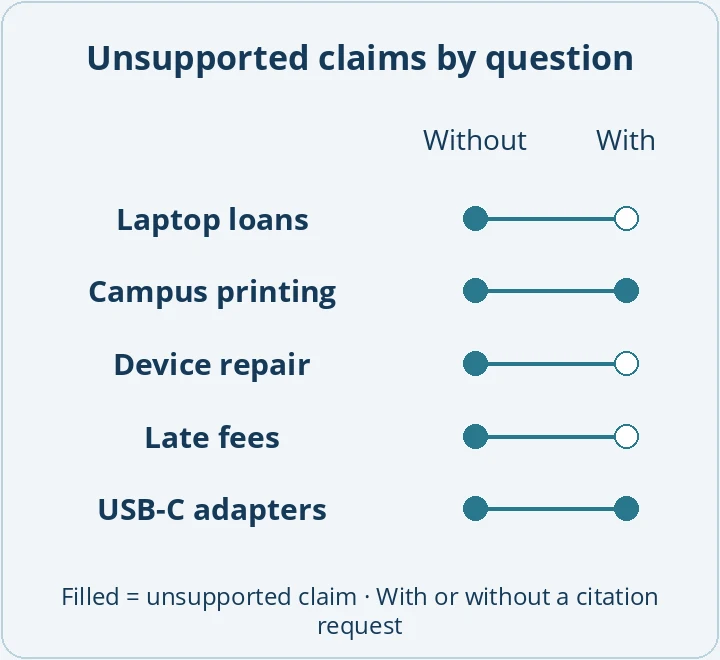
Keep the two answers to each question together. This shows you which cases contribute to the overall difference.
Score the answer and the reference separately
- The answer is complete
Without a citation request, 5 of 8 tasks covered by the handbook are answered fully. With a request, 7 of 8 are.
- There is no applicable rule
Without a citation request, the answers identify 2 of 4 gaps in the handbook. With one, they identify 3 of 4.
- The cited section supports the claim
Six of the nine cited passages actually support the claim.
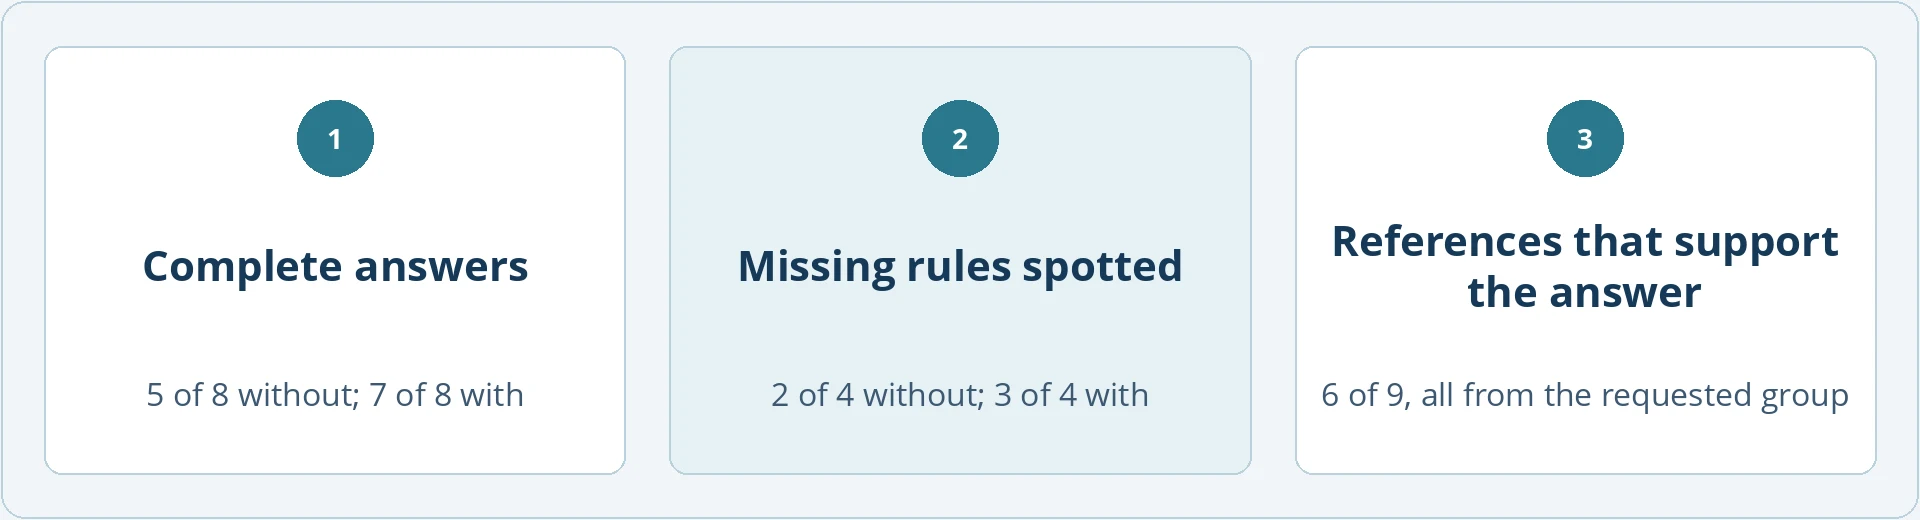
Give the total number of answers or passages you checked alongside each figure.
Exercise · Count answers with unsupported claims
Open the example data. For each group, count how many answers contain at least one unsupported claim. Count each answer at most once. Which questions receive a different score?
- Match answers to the same question
Match both answers to each question: without a citation request on the left, with one on the right. Check that you have both answers for all twelve questions.
Why? The questions can vary in difficulty. Pairing keeps the question constant. Resolve missing or duplicate answers before you start counting.
- Count the answers with errors
The result is 5 of 12 without a citation request and 2 of 12 with one. The unsupported claim disappears in three cases and remains in two, including campus printing.
Why? An answer with several problems counts once. The question asks how many answers are affected. Counting individual false claims would require a different rule.
- State the finding and its limits
In the fictional data, 5 of 12 answers without a citation request contained at least one false claim or one the handbook could not support. With a citation request, the figure was 2 of 12.
Why? Include the twelve answers per group so readers can check your calculations. The answers were written for this exercise. They illustrate the method and cannot establish a real effect of adding the instruction.
Further reading
 Criteria for assessing AI outputs and whether controls are effective.

KI-WERTBEITRAG
A quick guide to cost, benefit and business valueQUICK GUIDESForthcoming. Assess the benefits, effort and quality of AI use together.
Templates for this chapter
Work through the sample data or document calculations for your own project.
The guide and its figures are in English. The downloadable templates, handbook and example data are the German originals. In those files, “Campus printing” appears as “Campusdruck” and “With citation request” as “Mit Bitte um Fundstelle”.
Answer sheet for comparing AI responses
See both sample answers for each question and check the comparison.
Check the answer sheet
Spot missing, duplicate or hard-to-compare answers.
Log your data checks
Record unusual rows, unresolved cases and the decisions you made.
Analyse the answers in Excel
Count unsupported claims and compare the answers to each question.
Test a causal claim
Check whether your data support a conclusion about cause and effect.
Write an analysis memo
Record your result, how you calculated it and where the evidence is.
Someone else can reproduce your result
- You have two answers to all twelve questions.
- You assessed accuracy, completeness and citations separately.
- You identify the figures from the exercise as sample data.